Chapter 1. The Data You’re Sitting On Is Worth More Than You Think
Overview
- Purpose: Why legacy businesses are sitting on a gold mine of untapped operational data – and why the companies that figure out how to use it will pull away from those that don’t. The competitive gap, the margin compression, and why this moment is different.
- You will learn: The real competitive advantage hiding in your existing data, why traditional companies have unique data assets that tech companies would envy, how the economics of analytics have changed in the last five years, and what separates companies that thrive from those that slowly fall behind.
- Tools needed: None – this chapter is about understanding the opportunity
- Time to implement: 30 minutes to read and complete the self-assessment exercise
The Story: “The Contract They Lost”
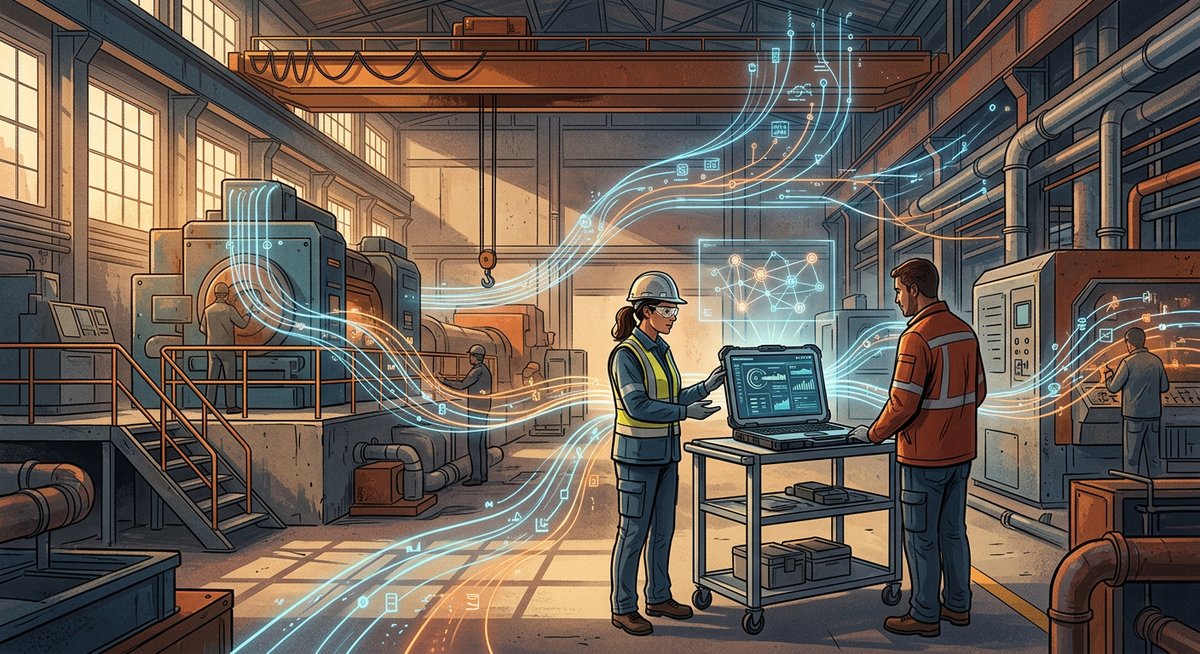
Maria Vasquez sat in the parking lot of Precision Components for eleven minutes after the call ended, engine idling, hands still gripping the steering wheel. Twenty-two years at this company. Worked her way up from quality engineer to VP of Operations. She knew every machine on the floor by the sound it made. She could spot a bad stamping by the way light caught the edge. And none of that mattered today.
The call had been from John Brennan, director of supply chain at Meridian Automotive, a Fortune 500 tier-one supplier that represented $6.2 million in annual revenue for Precision Components. John had been polite. He always was. But the message was clear: Meridian was consolidating suppliers, and every vendor remaining on their approved list needed to complete their new supplier scorecard by October 1st. The scorecard required data that Maria could not produce.
Overall Equipment Effectiveness by production line, broken down monthly for the past two years. First pass yield by part number. Defective parts per million, tracked by customer. On-time delivery performance calculated from original promise date, not the most recent confirmed date. Statistical process control data showing Cpk values for critical dimensions.
Maria knew her plant was good. Her people were good. Their quality was among the best in the region – she believed that with every fiber of her being. But she could not prove it. Their 15-year-old Epicor ERP system tracked production orders and financials, but OEE was not calculated anywhere. First pass yield was recorded on paper inspection sheets that went into binders that went onto shelves that went into a storage room. On-time delivery? That depended on which spreadsheet you pulled up – shipping had one version, sales had another, and customer service had a third. None of them agreed.
She had asked her plant manager to compile the data manually. He estimated it would take three people two weeks, and even then the numbers would be approximations stitched together from multiple systems that had never been designed to talk to each other. The deadline was five weeks away.
Two days later, Meridian awarded the contract to a competitor – a shop fifteen percent smaller than Precision Components, but one that had installed a modern BI system two years ago. They produced the entire scorecard in forty-five minutes. Maria did not lose the contract because her plant was worse. She lost it because she could not show that her plant was better. That distinction haunted her for months.
The Gold Mine You Are Standing On
Here is a truth that nobody in Silicon Valley will tell you: the most valuable untapped data in the American economy is not sitting in a tech startup’s servers. It is sitting in the ERP systems, spreadsheets, SCADA historians, quality databases, and filing cabinets of traditional businesses – manufacturers, utilities, construction firms, food processors, distributors, and the thousands of other companies that make the physical economy work.
You have data that a tech company would pay millions to acquire. Years of production records. Decades of customer transaction history. Maintenance logs that contain patterns no one has ever analyzed. Quality records that hide correlations between process parameters and defect rates. Supply chain data that could predict disruptions if anyone were looking at it systematically.
The problem is not that you lack data. The problem is that your data is trapped – scattered across systems that do not communicate, locked in spreadsheets that only one person understands, buried in paper records that have never been digitized, and encoded in the tribal knowledge of employees who are five years from retirement.
You are sitting on a gold mine. You just have not built the mine shaft yet.
The Competitive Gap Is Widening
There was a time when every company in your industry operated the same way. Everyone ran reports from their ERP. Everyone used spreadsheets for analysis. Everyone made decisions based on experience and gut feel, supplemented by data that was weeks old and partially inaccurate. The playing field was level because nobody had an information advantage.
That era is ending.
Industry surveys paint a stark picture. Among manufacturers, 74% say they are held back by disconnected data. Meanwhile, companies that have invested in analytics capabilities report 5-6% higher productivity and profitability than their peers. That gap compounds every year. A 5% productivity advantage does not sound dramatic until you realize it translates to better pricing, faster delivery, lower scrap rates, and the ability to take on contracts that data-poor competitors cannot even bid on.
The BI market has grown to nearly $40 billion globally, with cloud BI deployments rising from 46% to 65% in just two years. Self-service BI adoption has increased 31% year over year. The companies driving this growth are not all tech giants – they include mid-market manufacturers, regional utilities, and construction firms that decided their spreadsheet-based reporting was costing them contracts, compliance violations, and competitive position.
The uncomfortable truth is this: your competitors are starting to figure this out. Maybe not the one across town, not yet. But the ones that win the next big contract, pass the next regulatory audit, or recruit the next generation of workers? They will be the ones that can answer questions with data instead of guesses.
Why This Moment Is Different
You might be thinking: “We looked at analytics five years ago and it was too expensive, too complicated, and required people we could not hire.” That was probably true. Here is what has changed.
The cost has collapsed. Five years ago, building a data warehouse meant a six-figure infrastructure investment and a team of consultants. Today, a cloud data warehouse costs as little as $20-$200 per month for a small-to-midsize business. Google BigQuery gives you the first terabyte of queries free each month. A full analytics stack – data warehouse, ETL tools, and BI platform – can be assembled for under $500 per month for a 10-person team. Power BI costs $14 per user per month. The economics have fundamentally shifted.
The tools have simplified. Power BI looks and feels like Excel – the tool your people already know. Data integration platforms like Fivetran and Airbyte handle the plumbing between systems with point-and-click configuration instead of custom code. dbt lets you transform raw data using SQL, a language that most analysts and many business users already understand. You no longer need a team of data engineers to build a functioning analytics capability.
The cloud has eliminated infrastructure barriers. You do not need to buy servers, configure networking, or hire system administrators. Cloud platforms like Azure, AWS, and Google Cloud handle all of that. You pay for what you use, scale up when you need to, and scale down when you do not. For companies with small or stretched IT teams, this is transformative.
AI has arrived as an accelerator. AI-powered features built into modern BI tools can automatically detect anomalies, identify trends, generate natural-language explanations of data, and even build basic predictive models without requiring a data scientist. These are not theoretical capabilities – they are shipping features in Power BI, Tableau, and every major analytics platform.
The barriers that made analytics impractical for legacy businesses five years ago have largely fallen. What remains is not a technology problem. It is a knowledge problem and a will problem. This book addresses both.
The Cost of Doing Nothing
Let us talk about what bad data and manual reporting actually cost your business. Not in the abstract, but in dollars you can trace.
The reporting tax. How many hours per month does your team spend gathering, reconciling, and formatting data for management reports? At a typical legacy business, monthly management reporting takes 5-12 working days. If you have three people spending half their time on reporting for two weeks each month, that is roughly 120 hours per month, or 1,440 hours per year. At a fully loaded cost of $40 per hour, that is $57,600 per year – spent not on analysis, not on improvement, not on decision-making, but on the manual assembly of information that should flow automatically.
The wrong-decision tax. When decisions are made on stale or inaccurate data, the cost is invisible but real. A production scheduling decision based on last week’s numbers instead of today’s reality means overtime, expedited shipping, and missed delivery dates. A purchasing decision based on inaccurate inventory counts means either stockouts (lost production) or excess inventory (carrying costs of 20-30% annually). Gartner estimates that poor data quality costs organizations an average of $12.9 million per year.
The lost-opportunity tax. This is the hardest to quantify but often the largest. The contract you did not bid on because you could not produce the required data. The price increase you did not implement because you could not quantify your true costs. The quality problem you did not catch early because the data was in a binder instead of a dashboard. The customer you lost because their complaint sat in an email instead of a tracking system.
The compliance tax. Regulatory reporting – whether it is OSHA safety data, USDA food safety records, EPA environmental monitoring, or utility reliability metrics – consumes enormous staff time at companies that track compliance data manually. At Doug Henriksen’s utility, regulatory reporting takes three people working full-time for two weeks every quarter. That is 480 hours per year dedicated to assembling data that could be generated automatically if the underlying systems were connected.
Add it up and most legacy businesses are spending $100,000 to $500,000 per year on the consequences of poor data management – through wasted labor, bad decisions, lost contracts, and compliance overhead. That is not a technology cost. That is an operational cost, and it is already in your budget. You are just paying it in small, invisible installments instead of one visible line item.
What Data-Driven Actually Looks Like
The term “data-driven” has been overused to the point of meaninglessness. Let us define it concretely for a traditional business.
Being data-driven does not mean replacing human judgment with algorithms. It does not mean building a data science lab or hiring twenty analysts. It does not mean dashboards on every wall and metrics in every meeting.
Being data-driven means three things:
One: You have a single source of truth. When someone asks “What was our on-time delivery rate last month?” there is one answer, not three. The data comes from one place, uses one definition, and is calculated one way. Arguments about whose spreadsheet is right become arguments about what to do about the number – which is a far more productive conversation.
Two: Information flows at the speed of decisions. If production decisions are made hourly, production data should be available hourly – not two weeks later in a monthly report. If purchasing decisions are made weekly, inventory data should refresh weekly. The data update cadence matches the decision cadence.
Three: Questions are answered with evidence, not anecdotes. Instead of “I think our scrap rate is going up,” you can say “Scrap on Line 3 increased from 2.1% to 3.8% over the last six weeks, driven by a tool wear issue on the secondary forming operation.” The first statement starts a debate. The second starts a solution.
That is it. Single source of truth. Timely information. Evidence-based decisions. Everything else – dashboards, predictive models, advanced analytics – builds on those three foundations.
The Legacy Business Advantage
Here is something that the analytics industry does not talk about enough: legacy businesses have advantages that tech-native companies would love to have.
You have real data about real operations. A tech startup analyzing social media sentiment has interesting data. You have data about physical processes that produce physical products that generate physical revenue. Your data is grounded in reality in a way that digital-only businesses can only approximate.
You have historical depth. Your ERP has been accumulating transaction data for 10, 15, 20 years. That historical depth is enormously valuable for trend analysis, forecasting, and understanding seasonal patterns. A company that started collecting data last year cannot compete with that.
You have domain expertise. Your people understand your processes, your products, and your customers at a level that no outside consultant or data scientist can match. When you combine that domain expertise with modern analytics tools, the insights that emerge are far more actionable than anything a generic algorithm can produce.
You have clear, measurable processes. Manufacturing, construction, utilities, logistics – these industries have processes that produce quantifiable outputs. Units produced, defects per million, kilowatt-hours delivered, cubic yards poured, on-time deliveries. These are metrics that directly tie to revenue and cost. Compare that to a software company trying to measure “developer productivity” – your measurement problems are hard, but at least you know what you are trying to measure.
The irony is that the companies with the most valuable operational data are often the ones doing the least with it. This book is about changing that.
The Path Forward
This book is not going to sell you a vision and leave you to figure out the details. Every chapter provides specific tools, specific costs, specific steps, and specific outcomes. We are going to walk through the entire journey from where you are today – spreadsheets, legacy ERP, paper processes, tribal knowledge – to a functioning analytics capability that makes your business measurably better.
The journey follows a logical sequence:
Part I (Chapters 1-3) builds the case for change. You will assess where you stand, understand the gap, and build a business case that resonates with leadership.
Part II (Chapters 4-7) builds the foundation. You will escape the spreadsheet trap, get data out of your ERP, stand up your first data warehouse, and address data quality.
Part III (Chapters 8-10) turns data into insights. You will choose a BI tool, design KPIs that actually drive decisions, and build dashboards that people use.
Part IV (Chapters 11-12) introduces advanced capabilities. Predictive analytics and automated data pipelines – the features that separate good analytics from great analytics.
Part V (Chapters 13-15) makes it stick. Building your data team, managing change across the organization, and executing a 12-month roadmap.
You do not need to implement everything at once. In fact, you should not. The companies that succeed with analytics start small, prove value quickly, and expand from a position of demonstrated results. Your first dashboard, built on one clean data source, answering one important question – that is where transformation begins.
Try This Now (15 Minutes)
Grab a piece of paper or open a blank document. Answer these five questions about your organization:
How long does it take to produce your monthly management report? Count the total hours spent by all people involved, from data gathering through final presentation. Write down the number.
What is the one question that causes the most arguments in leadership meetings? The question where three people have three different answers. Write it down.
List every system that contains business data. ERP, spreadsheets, standalone databases, paper logs, email, personal files. List them all. Count them.
Name the person who would cause the most damage if they left tomorrow. Not the CEO – the person whose knowledge, spreadsheets, or processes cannot be replicated. Write their name and what they control.
What contract, customer, or opportunity have you lost (or nearly lost) because you could not produce the required data? Write down the specific situation and the approximate revenue impact.
These five answers define your starting point. They will also form the core of the business case you build in Chapter 3. Keep this document – you will reference it throughout the book.
Key Takeaways
- Legacy businesses are sitting on enormously valuable operational data – years of production records, quality data, customer transactions, and maintenance logs – but that data is trapped in disconnected systems, spreadsheets, and tribal knowledge, making it invisible to decision-makers.
- The economics of analytics have fundamentally changed: a complete data stack (warehouse, ETL, BI tool) can be assembled for $200-$1,600 per month, and modern tools like Power BI at $14 per user per month have eliminated the cost barrier that made analytics impractical for mid-market businesses five years ago.
- The cost of doing nothing is not zero – most legacy businesses are spending $100,000 to $500,000 per year on the consequences of poor data management through wasted reporting labor, bad decisions, lost contracts, and compliance overhead.
This Week’s Action Items
Next Up
In Chapter 2, we will explore Know Your Starting Point – The Analytics Maturity Assessment. You will diagnose exactly where your organization sits on the analytics maturity ladder and identify whether you are living in a Spreadsheet Kingdom, an ERP Prison, or a Data Island Chain – and what to do about it.