Chapter 1. What FP&A Actually Is (And Why Your Company Doesn’t Have It)
Overview
- Purpose: The difference between accounting and FP&A – one looks backward, the other looks forward. Why legacy businesses end up with no planning function, and what it costs them in missed opportunities and bad capital decisions.
- You will learn: What financial planning and analysis actually means versus accounting and controllership, why 60-70% of mid-market companies have no formal FP&A function, the hidden cost of operating without forward-looking financial analysis, and how to recognize the symptoms that your company is flying blind.
- Tools needed: None – this chapter is about understanding the problem before building the solution
- Time to implement: 30 minutes to read; 1 hour to complete the diagnostic exercise at the end
The Story: “Forty-Seven Spreadsheets”
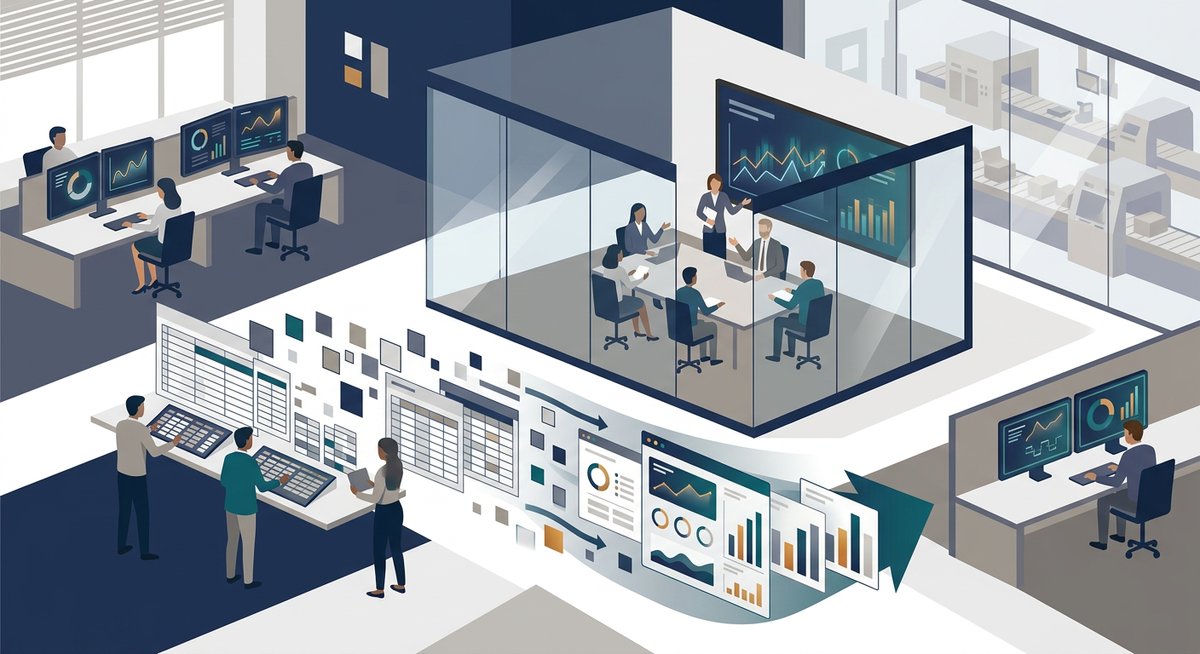
Maria Delgado opened her laptop at 6:40 AM, twenty minutes before anyone else would arrive at Heartland Metal Products. The office was quiet – the production floor below would not start up until the 7 AM shift change – and she needed the silence. October had arrived, which meant budget season, which meant the next ten weeks of her life would disappear into a black hole of Excel workbooks.
She pulled up the master file. It was called “FY2027 Budget MASTER v3 FINAL revised MLD.xlsx,” and it was the third “final” version this week. The workbook contained 23 tabs, and it was linked to 24 other workbooks sitting in a shared drive folder that she had organized, reorganized, and reorganized again over the past five years. Forty-seven spreadsheets in total. She knew the exact number because she had counted them during a moment of exhausted clarity at 11 PM on a Tuesday in November the previous year.
Each department head had received their budget template in September. Most had returned something. The plant manager, Dave, had sent back a workbook with his numbers pasted as values – no formulas, no assumptions, just numbers in cells. When Maria asked what drove the $180,000 increase in maintenance expense, Dave said, “Things are getting older.” The VP of Sales had not submitted anything yet. His assistant had emailed Maria to say he was “still working on the revenue number” and would have it “soon.” It was October 14th. The board wanted a final budget by December 1st.
Maria opened the consolidation tab and watched the cells populate. Three of them showed #REF! errors. She sighed, opened the linked workbook for the stamping department, and found the problem: someone had inserted a row in the middle of a named range, breaking the formula chain. She fixed it. She always fixed it. She had been fixing these workbooks since she became controller five years ago, and she knew – with the bone-deep certainty of someone who has done the same painful thing too many times – that she would be fixing them again next October.
Her phone buzzed. A text from the CEO, Tom: “Can you tell me what happens to margins if steel prices go up 15%? Board wants to know.” Maria stared at the message. The honest answer was that she had no model that could answer that question. She could pull last year’s material costs from the ERP, calculate what a 15% increase would mean in dollars, and manually adjust a few cells in the budget. It would take her most of the day, and the answer would be rough at best. She did not have a driver-based model that linked steel prices to product costs to margins to cash flow. She did not have a scenario model. She did not have a rolling forecast. She had forty-seven spreadsheets, a twelve-day month-end close, and a budget process that consumed four months of her life every year.
Maria was a CPA with eighteen years of experience. She ran a six-person accounting team. She was good at her job – maybe too good, because her competence had become the company’s excuse for never building anything better. She was the controller, the budget analyst, the ad hoc financial modeler, and the Excel support desk for every department head who broke a formula. She was, by default, the entire FP&A function at a $120 million manufacturer.
She just did not know that was what it was called.
Accounting Looks Backward. FP&A Looks Forward.
The simplest way to understand FP&A is to understand what it is not. It is not accounting.
Accounting answers the question: What happened? The books are closed, the financial statements are produced, the tax returns are filed, the audit is completed. Accounting is essential, regulated, and backward-looking by design. Every number in a set of financial statements describes something that already occurred.
Financial Planning and Analysis answers a different set of questions: What will happen? What should happen? What could happen? FP&A is the forward-looking counterpart to accounting. Where accounting records the past, FP&A projects the future. Where accounting produces financial statements for compliance, FP&A produces forecasts, scenarios, and analyses for decision-making.
Here is a practical way to see the difference:
| Question | Who Answers It | Function |
|---|---|---|
| What was our revenue last quarter? | Accounting | Backward-looking |
| What will our revenue be next quarter? | FP&A | Forward-looking |
| Did we hit our expense budget? | Accounting | Backward-looking |
| Why did we miss, and what do we do about it? | FP&A | Forward-looking |
| What is our gross margin? | Accounting | Backward-looking |
| What happens to margin if steel goes up 15%? | FP&A | Forward-looking |
| How much cash do we have? | Accounting | Backward-looking |
| Will we have enough cash in 13 weeks? | FP&A | Forward-looking |
| What did we spend on CapEx this year? | Accounting | Backward-looking |
| Which capital project should we fund next? | FP&A | Forward-looking |
At a company with a mature finance function, these are two separate teams with distinct skill sets, tools, and deliverables. At most legacy mid-market businesses, one person – usually the controller – tries to do both. And since accounting has hard deadlines (the close, the audit, the tax filing), it always wins. The forward-looking work gets squeezed out. The budget gets done because it has to, but it is a compliance exercise, not a planning tool. The rolling forecast does not exist. The scenario model does not exist. The variance analysis is a column nobody reads.
What FP&A Actually Does
A well-functioning FP&A team delivers five core capabilities. At a legacy business, you probably have zero or one of these today.
1. Budgeting and Planning. Not just the annual budget – although that is where most companies start – but a structured planning process that connects operational drivers to financial outcomes. Instead of asking department heads “how much will you spend next year?” a driver-based budget asks “how many units will you produce, at what cost per unit, using how many labor hours?” The numbers flow from the business logic, not from last year’s actuals plus five percent.
2. Forecasting. An ongoing view of where the business is heading, updated monthly or quarterly. A rolling forecast extends twelve to eighteen months into the future and is continuously refreshed. Unlike the annual budget, which is set in December and ignored by March, a rolling forecast reflects current reality. Only 49% of all companies use rolling forecasts today, and at legacy businesses, that number is likely below 20%.
3. Variance Analysis. The systematic investigation of why actual results differ from the plan. Real variance analysis decomposes differences into their root causes – price, volume, mix, timing, and operational factors – and leads to action. It is not a column in a spreadsheet showing “Budget: $500K, Actual: $580K, Variance: ($80K).” It is the answer to “why are we $80K over, and what are we going to do about it?”
4. Scenario Modeling. The ability to answer “what if?” questions with rigor instead of guesswork. What if our largest customer reduces orders by 20%? What if raw material prices spike? What if we add a third production shift? Only 38% of companies use structured scenario planning. At legacy businesses, the figure is likely under 15%.
5. Capital Planning. A structured framework for evaluating capital investments using NPV, IRR, and payback period analysis instead of gut feel. This includes post-completion reviews that compare actual project returns to the original business case – a practice that almost no legacy business performs.
Why Your Company Does Not Have FP&A
If you are reading this book, your company probably falls into one of these categories. There is no judgment here – these are structural realities of how mid-market legacy businesses operate.
The Overloaded Controller. This is Maria’s situation. The controller is smart, capable, and exhausted. She does the budget, produces the financial statements, manages the close, handles the audit, and runs ad hoc analyses whenever the CEO asks. She is the entire planning function by default, and the quality of the planning work suffers because accounting always takes priority. The company has never hired a dedicated FP&A person because the controller “handles it.”
The Compliance-Only Shop. Finance exists to keep the lights on: pay bills, collect receivables, file taxes, close the books. There is no budget process beyond what the bank or the board requires. Financial reporting is the income statement, balance sheet, and maybe a cash flow statement. Nobody is asking “what should we do differently?” because nobody is generating the analysis that would prompt the question.
The Annual-Budget-and-Nothing-Else Company. A budget gets built every year, usually by the controller with minimal input from operations. It is approved by the board, filed away, and referenced only when someone asks “are we over budget?” at the end of a quarter. There is no forecast, no scenario analysis, no variance investigation, and no connection between the budget and operational decision-making.
The Owner Runs It by Feel. At family-owned and owner-operated businesses, the founder or CEO has decades of industry experience and makes decisions based on intuition, relationships, and pattern recognition. This worked when the company was $20 million in revenue. At $85 million, the complexity has outgrown the ability of any single person to hold the whole picture in their head. But the culture of “I know this business” makes it hard to justify what feels like corporate overhead.
These patterns are not unique. Roughly 200,000 mid-market companies operate in the United States, and an estimated 60-70% of them lack a dedicated FP&A function. The median finance department at a $100 million company has approximately eight staff – most of whom are doing accounting work, not analysis. The FP&A role simply does not exist on the org chart.
What Not Having FP&A Actually Costs You
The cost of not having FP&A is invisible until it is not. It shows up in decisions that were made without analysis, opportunities that were missed because nobody modeled them, and risks that materialized because nobody was watching.
Bad capital decisions. Every legacy business has at least one: the equipment purchase that did not deliver the expected return, the facility expansion that was timed wrong, the acquisition that looked good on a napkin but fell apart in execution. Companies that deploy structured capital evaluation practices – NPV analysis, IRR hurdles, post-completion reviews – save 15-30% on capital projects. When a $120 million manufacturer makes $8-12 million in annual capital decisions without rigorous analysis, the potential waste is measured in millions.
Stale information. When month-end close takes ten to twelve business days, leadership is making decisions based on data that is two to three weeks old. Best-in-class organizations close in one to three business days. The gap is not just about speed – it is about relevance. By the time a legacy business produces its monthly financial package, the numbers describe a reality that has already changed.
No early warning system. Without rolling forecasts and variance analysis, problems are discovered after the fact. A margin compression that started in February is not identified until the Q1 financial statements are produced in late April. By then, three months of margin erosion have already occurred. FP&A acts as the early warning system – catching trends, flagging risks, and giving leadership time to respond.
Inability to answer strategic questions. When a private equity firm calls with acquisition interest, can your team produce a detailed financial model? When the board asks for a five-year financial plan, can you deliver one? When a customer asks for a long-term pricing commitment, can you model the margin impact? At most legacy businesses, the answer to all three questions is no. The controller can produce historical financial statements, but forward-looking analysis requires capabilities that do not exist.
The time tax. FP&A teams across all industries spend 42-50% of their time on data collection and validation, and another 25-33% on process administration and reporting. That leaves only 23-31% for actual value-added analysis and insight. At a legacy business without dedicated FP&A, the ratio is worse – the controller spends 80-90% of their time on accounting and compliance, leaving almost nothing for the analysis work that drives better decisions.
The Maturity Gap
The FP&A Board defines five stages of FP&A maturity:
| Stage | Description | What It Looks Like | Estimated % of Companies |
|---|---|---|---|
| Lagging | Reactive, Excel-only, no formal FP&A role | The budget is an annual exercise. No forecast. Variance analysis is a column in a PDF. | 25-30% |
| Emerging | Basic budgeting, some reporting, ad hoc analysis | A controller or senior accountant handles planning. Some KPIs are tracked. | 30-35% |
| Defined | Formal FP&A function, structured processes | Dedicated FP&A team. Regular variance analysis. Monthly management deck. | 20-25% |
| Progressive | Driver-based planning, rolling forecasts, analytics | FP&A is a business partner. Scenario modeling. Operational KPIs. | 10-15% |
| Visionary | Fully integrated, predictive, strategic partner | Real-time dashboards. Predictive analytics. FP&A drives strategy. | 2-5% |
Most legacy businesses fall into the Lagging or Emerging stages. Only 2% of FP&A teams consider themselves fully optimized, and only 9% act as true strategic partners to their organizations. The goal of this book is not to get you to Visionary – that takes years and significant investment. The goal is to move you from Lagging to Defined within eighteen to twenty-four months, which is achievable with one dedicated person and the right processes.
The Excel Reality
Let us talk about the elephant in the room. Excel is not going away. And that is fine.
The numbers are striking: 96% of FP&A professionals use spreadsheets for planning. 93% use them for reporting on a daily or weekly basis. Even companies with dedicated FP&A software still rely heavily on Excel. At legacy businesses, Excel is not just the primary tool – it is the only tool.
The problem is not Excel itself. Excel is powerful, flexible, and universally available. The problem is how Excel is used at most legacy businesses:
- No version control. “Budget FINAL v3 revised FINAL (2).xlsx” is a real filename pattern.
- No data model. Numbers are hard-coded, not connected to drivers.
- No audit trail. When a number changes, there is no record of who changed it or why.
- Broken links. When forty-seven workbooks are linked together, one inserted row can cascade errors across the entire model.
- Single points of failure. If the person who built the model leaves – or is sick for a week – nobody else can maintain it.
- No collaboration. Multiple people cannot work in the same model simultaneously.
This book will teach you how to build FP&A capabilities starting in Excel – because that is what you have. Later chapters will cover Power Query, Power Pivot, and when it makes sense to invest in dedicated FP&A software. But the first step is not a technology upgrade. The first step is understanding what FP&A is and why it matters.
The Path from Here
This book is organized around a practical reality: you are starting from scratch. You may be a controller who has been told to “build better planning.” You may be a new FP&A hire walking into a company that has never had your role. You may be a CFO who knows the company needs better financial planning but does not know where to start. You may be a CEO who is reading this because your banker, your board, or a potential acquirer has told you that your financial planning capabilities are inadequate.
Whoever you are, the path is the same:
- Understand where you are (Chapter 2) – a maturity assessment that will diagnose your starting point.
- Make the case (Chapter 3) – how to sell FP&A to leadership that does not know what it is.
- Build the structure (Chapters 4-5) – organizing the function and hiring your first FP&A person.
- Establish core processes (Chapters 6-10) – budgeting, forecasting, variance analysis, reporting, and capital planning.
- Add advanced capabilities (Chapters 11-12) – scenario planning and dashboards.
- Become a business partner (Chapter 13) – moving from report generator to trusted advisor.
- Choose the right tools (Chapter 14) – technology decisions that match your maturity level.
- Execute the roadmap (Chapter 15) – a day-by-day implementation plan for your first 180 days.
Maria Delgado did not know she was the FP&A function. By the end of this book, she will have built a real one.
Try This Now (15 Minutes)
Pull up the most recent budget or financial report your company produced. Answer these five questions honestly:
How long did it take to produce? Count from the day the process started to the day the final version was approved. If the answer is more than six weeks, your budget process has significant room for improvement.
How many people touched it? Count every person who provided input, reviewed, revised, or approved. Now count how many of those people are dedicated finance/planning professionals versus operational leaders filling in templates.
Can you answer a “what if?” question in under an hour? Pick a real scenario: What if your largest customer cuts orders by 20%? What if raw material costs increase by 10%? If you cannot model the impact quickly, you do not have a planning capability – you have a compliance exercise.
When was the last time a financial analysis changed a decision? Not confirmed a decision that was already made, but actually changed the direction. If you cannot point to a specific example in the last twelve months, your financial analysis is not connected to decision-making.
Does your team produce any forward-looking deliverables? A rolling forecast, a scenario model, a cash flow projection, a capital evaluation framework. If the answer is no, you are operating with a pure accounting function and no FP&A capability.
Write down your answers. They will serve as your baseline when you complete the maturity assessment in Chapter 2.
Key Takeaways
FP&A is the forward-looking counterpart to accounting – it answers “what will happen?” and “what should we do?” while accounting answers “what happened?” Most legacy mid-market businesses have the accounting function but not the planning function, which means leadership is making decisions without forward-looking analysis.
The cost of not having FP&A is invisible but real – it shows up in bad capital decisions made on gut feel, stale financial information that arrives weeks after close, no early warning system for margin erosion or cash flow problems, and an inability to answer the strategic questions that boards, lenders, and potential acquirers ask.
Roughly 60-70% of the 200,000 mid-market companies in the United States lack a dedicated FP&A function, and 45% of all companies still rely on a static annual budget as their only planning tool – the opportunity to build even a basic FP&A capability creates enormous competitive advantage.
This Week’s Action Items
Next Up
In Chapter 2, we will walk through a structured maturity assessment that diagnoses exactly where your company stands today. You will meet Roy Hutchinson, a third-generation CEO whose company could not answer the questions a private equity firm asked during an acquisition conversation – and you will learn how to score your own organization against the same framework.